

Digital Signage Analytics: Measure, Prove, and Grow

Digital signage analytics measure who sees your screens, for how long, and which content drives real action. At their core, they convert screen activity into business intelligence, giving you the data to prove ROI, refine content, and keep your network running at full capacity. The primary outcomes they enable are revenue attribution, audience engagement optimization, and operational efficiency.
The core elements tracked across any well-configured deployment include:
Playback and proof-of-play: Verified logs confirming content ran on schedule
Impressions and opportunity-to-see: Estimated audience reach per screen or zone
Dwell time and attention: How long viewers engage with specific content
Interactions: Touches, QR scans, and click-throughs on interactive displays
Conversions and attribution: Sales lift, coupon redemptions, or event sign-ups tied to content exposure
Device health: Uptime, sync status, and hardware performance across your network
Industry bodies like AVIXA and the Digital Signage Federation have established measurement frameworks that treat these six elements as the foundation for any credible signage performance program. Getting them right from the start is what separates a network that generates insight from one that just plays content.
Key Takeaways
Effective digital signage analytics require a defined KPI set, validated measurement infrastructure, and a repeatable attribution method before any result can be presented as credible ROI.
Point | Details |
Start with 3–5 KPIs | Tie each metric to a specific business goal before selecting sensors or platforms. |
Baseline first, always | Run two weeks of unchanged measurement before testing any content variable. |
Uptime drives revenue | A ≥99.5% uptime target protects proof-of-play accuracy and ad billing integrity. |
Privacy requires anonymization | Process audience data at the edge and post visible notice in all measured zones. |
Signstream bundles measurement | Proof-of-play logs, QR tracking, device health, and ad exchange reporting are included across unlimited screens. |
Table of Contents
What digital signage analytics actually track, and why it matters
The term “analytics” covers a wide range of measurement activities in the signage industry, from simple playback logs to edge-based computer vision. Understanding the distinction helps you ask the right questions of any vendor or internal team.
Proof-of-play is the baseline. It confirms that a specific piece of content ran on a specific screen at a specific time. Without it, you cannot verify ad delivery, audit content compliance, or defend billing to an advertiser. Every serious platform exports these logs in CSV or JSON format.
Audience measurement goes further. Edge-based analytics process video on-device, generating anonymous attention scores, dwell estimates, and verified view counts without uploading footage to the cloud. This approach reduces bandwidth, lowers privacy risk, and is often legally simpler in the U.S. than cloud-uploaded video. For locations where cameras are impractical, passive Wi-Fi and Bluetooth signals can approximate reach and repeat visitation without image capture, making compliance considerably easier.
Content performance analytics sit above both layers. They answer the question every marketer actually cares about: did this creative drive behavior? Connecting screen exposure data to POS transactions, CRM records, or event registrations is what turns a playback log into a revenue story.
Which metrics and KPIs should you actually track?
Most teams make the mistake of tracking everything available and reporting on nothing useful. Industry guidance consistently recommends starting with 3–5 core KPIs tied directly to business goals, then expanding as measurement maturity grows.
The table below maps common business objectives to the KPI that best serves them, a realistic target, and the measurement method required.
Business goal | KPI | Example target | How to measure |
Maximize reach | Impressions / opportunity-to-see | Baseline + growth over time | Passive signals or edge vision |
Prove content attention | Verified views / dwell time | ≥5 seconds average per content slot | Edge camera or attention sensor |
Drive in-store action | Interaction rate | ≥2% of passersby | Touch logs, QR scan counts |
Attribute revenue | Conversion rate / sales lift | Positive vs. control period | POS correlation or coupon redemption |
Maintain network reliability | System uptime | CMS dashboard / NOC integration | |
Control costs | Total cost of ownership (TCO) | Defined at procurement | Finance + IT combined reporting |
Keep content current | Content freshness | Less than one day update lag | CMS timestamp logs |
Measurement method matters as much as the metric itself. Impressions derived from passive Bluetooth signals carry different confidence levels than verified views from a calibrated edge camera. Document the method alongside the number when presenting results to stakeholders, or the figures will be challenged.
Pro Tip: Set your baseline before you change anything. Run your chosen KPIs for at least two weeks with no content changes, then use that data as your control. Without a baseline, every result is just a number with no context.
What report types will you rely on?
Knowing which reports exist, and what each one answers, saves hours of back-and-forth with vendors and IT teams. The table below covers the standard report types across most enterprise and mid-market platforms.
Report type | Primary question answered | Common export formats |
Proof-of-play log | Did this content run on schedule? | CSV, JSON |
Asset performance report | Which creative drives the most engagement? | CSV, dashboard |
Screen / device health report | Is this screen online and current? | Dashboard, API |
Audience cohort report | Who is watching, and when? | Dashboard, CSV |
A/B test results | Which version performed better? | Dashboard, CSV |
Network roll-up report | How is the full network performing? | Dashboard, PDF export |
Proof-of-play logs and asset performance reports are the two most requested by advertisers and retail media network operators. They form the audit trail that justifies ad spend and supports billing reconciliation. Screen health and network roll-up reports, by contrast, are primarily operational: they belong in NOC and IT workflows, not marketing decks.
For teams building in-store promotion workflows, the asset performance report is the one that connects creative decisions to sales outcomes. Pair it with a POS export from the same time window and you have the raw material for a credible attribution analysis.
How do you convert analytics into measurable ROI?
ROI from digital signage is not a single calculation. It is a repeatable process that starts before you change a single piece of content. Many successful projects treat analytics as a three-part system: measurement, validation, and attribution. Here is how to run that process in practice.
Define your metric and baseline. Choose one primary KPI (sales lift, attendance, QR redemptions). Measure it for two weeks with no changes.
Instrument your data sources. Connect your CMS to POS, CRM, or event registration data. Confirm that timestamps align across systems.
Run a controlled test. Change one variable (creative, placement, or schedule) on a subset of screens. Keep the rest as a control group.
Analyze the uplift. Compare the test group’s KPI to the control group’s KPI over the same period.
Attribute revenue. Apply the uplift percentage to the revenue base to calculate incremental gain.
The ROI formula:
A compact worked example: A fitness club runs a class promotion on lobby screens for 30 days. Attendance in the promoted class rises from 40 to 50 participants per week. At $15 per class, that is $150 in incremental weekly revenue, or $600 over the test period. If the monthly signage cost is $200, ROI = ((600 − 200) ÷ 200) × 100 = 200%. Signstream clients have reported results consistent with this scale, including a documented 25% rise in class attendance following deployment.
Watch for these attribution pitfalls:
Seasonality: A January fitness surge will inflate attendance numbers regardless of your screens. Use year-over-year comparisons or a concurrent control location.
Co-incident promotions: If a social media campaign ran during your test window, isolate its contribution before claiming the lift for signage.
Short test windows: Two weeks is a minimum. Four weeks is more reliable for weekly-cycle businesses like gyms and restaurants.
Marketing analytics research shows that data-driven attribution consistently outperforms single-touch models when multiple channels are active simultaneously, which is exactly why documenting your test conditions matters.
How to set up analytics correctly and avoid measurement errors
A well-planned deployment produces clean data. A rushed one produces numbers you cannot trust. The difference usually comes down to decisions made before installation day.
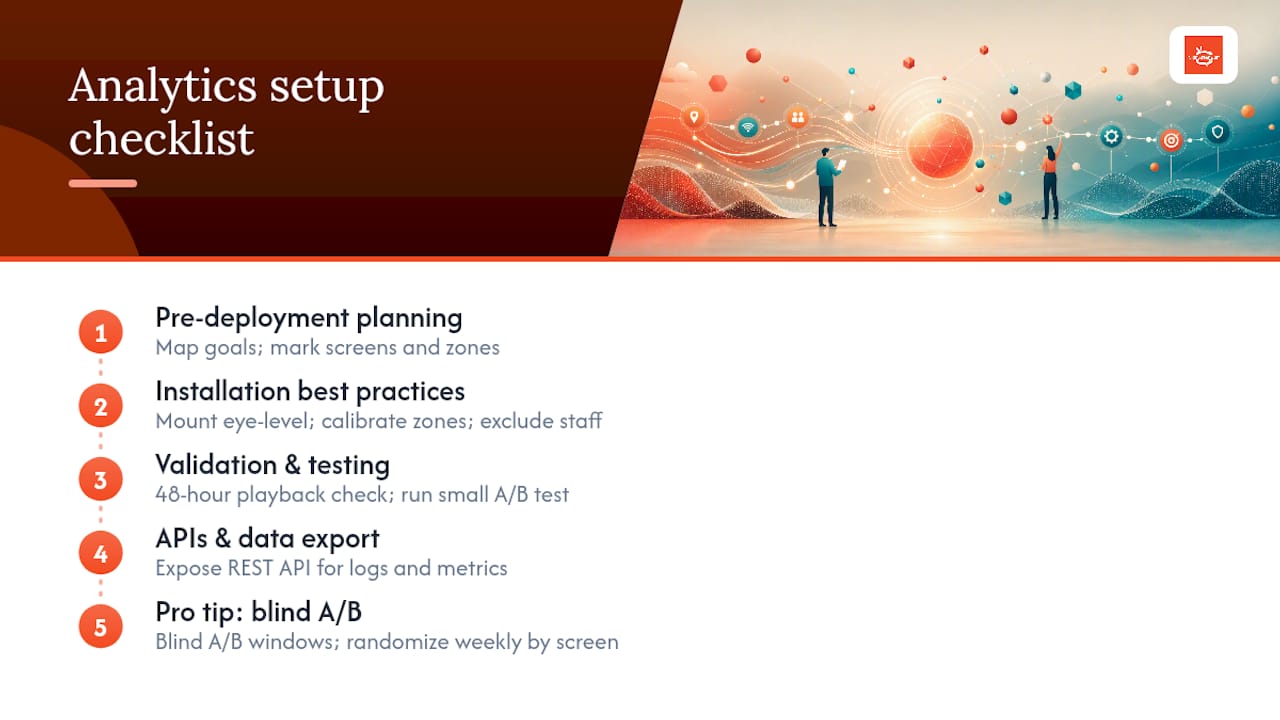
Pre-deployment planning starts with mapping your goals to your data sources. Identify which screens will carry measured content, where sensors or cameras will be placed, and which back-end systems (POS, CRM, event platforms) need to connect. Draw floor plans with measurement zones marked before any hardware ships.
Installation best practices for camera-based analytics include mounting at eye level or slightly above, calibrating zones to exclude staff areas and back-of-house traffic, and setting time-of-day windows that match your audience’s actual presence. Staff filtering is often overlooked: a busy retail location where employees walk past screens dozens of times per day will inflate impression counts significantly if you do not exclude them.
Validation steps are non-negotiable. After installation, run a 48-hour playback verification to confirm proof-of-play logs match your scheduled content. Then run a small A/B test with two content variants on adjacent screens to confirm the measurement system can detect a difference. If it cannot, your sensor placement or zone calibration needs adjustment before you run any real tests.
“The biggest measurement mistake teams make is skipping the validation phase. You can have the best sensors in the world, but if your zones are miscalibrated or your POS timestamps are offset by an hour, every number downstream is wrong.”— AVIXA digital signage analytics case study, ASUS deployment
APIs and data export are where analytics become genuinely useful at scale. A capable CMS exposes a REST API that lets your BI team pull proof-of-play logs, device health data, and audience metrics into tools like Tableau, Power BI, or Google Looker Studio. Developer resources for integration workflows, including open-source examples, are available through repositories like Intuiface’s GitHub organization.
Pro Tip: Use blind A/B windows, where neither your content team nor your sales team knows which variant is running, to eliminate confirmation bias. Randomize screen assignments weekly rather than by location to control for foot traffic differences.
Device monitoring, network health, and U.S. privacy compliance
Operational analytics and audience analytics are two separate disciplines, but they share the same infrastructure. Neglecting device health monitoring undermines the credibility of every audience metric you collect.

Device metric | Why it matters | Monitoring method |
System uptime | Proof-of-play gaps destroy ad billing accuracy | CMS dashboard / NOC alert |
Last sync timestamp | Stale content erodes audience trust and compliance | CMS log |
Firmware / software version | Outdated firmware creates security vulnerabilities | Device management console |
CPU / temperature | Overheating causes silent failures and reboots | Edge agent telemetry |
Ticketing integration | Unresolved issues extend downtime | Helpdesk API connection |
The ≥99.5% uptime target recommended by industry standards is not arbitrary. For a revenue-generating screen in a retail or hospitality environment, downtime below that threshold directly reduces verified impressions and, by extension, ad revenue.
U.S. privacy considerations for audience analytics are governed primarily by state-level law rather than a single federal framework. California’s CCPA, Virginia’s CDPA, and Colorado’s CPA each impose different obligations on businesses that collect behavioral data. For camera-based analytics, the practical checklist is:
Anonymize at the edge. Process video on-device and discard raw footage. Store only aggregate counts and attention scores.
Post visible notice. A clear sign near measured zones (“This area uses anonymous audience measurement”) satisfies notice requirements in most states and reduces public concern.
Limit retention. Aggregate audience data rarely needs to be retained beyond 90 days for operational purposes. Raw event logs for proof-of-play may need longer retention for billing audits.
Apply minimal data principles. Collect only what your measurement plan requires. Demographic estimates you never use in reporting create liability with no benefit.
For web-connected signage dashboards or public-facing portals that use analytics cookies, tools like the GDPR Cookie Compliance plugin provide consent banner management that teams can adapt for U.S. state-law contexts as well.
Security basics round out the compliance picture: provision devices with unique credentials, restrict management ports to internal networks, enforce TLS for all data in transit, and apply role-based access controls so that marketing teams see content reports while IT teams see device health data.
How do you choose the right analytics solution?
The right platform depends on your measurement goals, your team’s technical capacity, and the commercial model that fits your budget. Here is the feature checklist that should drive your evaluation.
Must-have features:
Proof-of-play exports in CSV or JSON with timestamps and content IDs
Real-time dashboard with device health and content status
Audience measurement mode (edge vision or passive signals, depending on privacy requirements)
API access for BI tool integration
Multi-location roll-up reporting for networks with more than one site
Role-based access controls and audit logs
Documented SLAs with uptime guarantees
Selection criteria by buyer type:
Operations and IT teams prioritize device health dashboards, uptime SLAs, and ticketing integration.
Retail marketing teams need asset performance reports, A/B testing, and POS integration for attribution.
Retail media network (RMN) operators require verified impression counts, proof-of-play exports, and advertiser-facing reporting.
Commercial models and what they imply for analytics costs:
Per-screen pricing is predictable and scales linearly. Analytics features are usually bundled, making cost-per-insight easy to calculate.
Per-view or per-impression pricing aligns cost to measured outcomes but can become expensive as audience measurement improves and verified view counts rise.
Flat license suits large networks where per-screen costs would be prohibitive. Confirm that analytics features are included, not add-ons.
For small teams deploying signage for the first time, a flat-license or per-channel model with bundled analytics is almost always the more affordable starting point. Evaluate platforms against the cloud signage alternatives available in your category before committing to a long-term contract.
How Signstream measures impact in real deployments
Signstream’s analytics capabilities map directly to the checklist above. The platform provides real-time content dashboards, proof-of-play logging, QR scan tracking, and device health monitoring across unlimited screens per channel, with no per-screen surcharge. Content updates push instantly from any browser or mobile device, so the “content freshness” KPI is easy to maintain without a dedicated IT team.
The ad exchange marketplace adds a layer of verified impression reporting that most standalone CMS platforms do not offer. When you cross-promote with other local businesses through Signstream’s network, each placement generates delivery data you can share with advertising partners, turning your screens into a measurable revenue channel rather than a cost center.
For ROI measurement, Signstream supports POS and CRM integrations that let you correlate screen exposure with transaction data, the same attribution methodology described in the ROI section above. Export options cover CSV for spreadsheet-based analysis and API access for teams connecting to BI platforms. The AVIXA case study on analytics deployments validates the same measurement approach Signstream uses: instrument, baseline, test, and attribute.
Hospitality operators can draw a direct parallel to deployments like the Disney World Swan and Dolphin Resort, where cloud-connected signage drove measurable guest engagement through timely, location-relevant content updates. The measurement principle is identical regardless of scale.
An honest take on where most analytics programs go wrong
The gap between what analytics promise and what most deployments actually deliver comes down to one thing: teams instrument their screens before they define what success looks like. They end up with dashboards full of numbers and no clear story to tell a stakeholder.
The 30/60/90-day framework below is the most practical way to close that gap.
Days 1–30: Define your three primary KPIs. Set up proof-of-play logging and confirm it is working. Establish baselines with no content changes. Document your measurement zones and data sources.
Days 31–60: Run your first A/B test on one content variable. Connect your CMS to one external data source (POS or event registration). Review device health reports and resolve any uptime gaps.
Days 61–90: Analyze test results and present an ROI calculation to stakeholders using the formula from this guide. Expand measurement to additional screens or locations. Audit your data retention and privacy notice practices.
One principle worth stating plainly: document your baseline before you touch anything, and post visible notice wherever audience measurement is active. Those two steps protect both your data quality and your compliance posture from day one.
Audience engagement strategies that connect measurement to behavior change consistently outperform those that treat analytics as a reporting exercise. The goal is not a better dashboard. It is a better decision made faster because the data was there when you needed it.
Signstream gives you analytics that actually connect to revenue
Signstream is the practical alternative to expensive, over-engineered signage platforms for businesses that need real measurement without a six-figure implementation budget. You get proof-of-play logging, real-time dashboards, QR scan tracking, and device health monitoring across unlimited screens, all managed from a single browser tab or your phone.
The ad exchange marketplace means your screens can generate verified impression data for advertising partners while you cross-promote with neighboring businesses, turning measurement into a direct revenue line. Setup does not require a technical team, and Signstream’s onboarding support walks you through analytics configuration from day one.
See exactly how the platform works and start a trial, or explore the ad display network if monetizing your screens is the priority. Either way, the measurement infrastructure is built in.
Sources
Use these references to build a measurement specification or add depth to an RFP appendix.
Recommended
Comments